Thursday 19 March 2026 · OEF: Day 19 · Post-FOMC Edition · No. 019
The "Mission Accomplished" Temptation
Twenty-Three Years After Iraq's "Shock and Awe," the Federal Reserve Holds Rates While Brent Surges Past $109, and a $846 Trillion Derivatives Book Discovers the Cost of Its Excluded Variables
§ I · Historical AnchorTwenty-Three Years of Shock and Awe: What Baghdad Taught and Tehran Confirms
Twenty-three years ago this morning — March 19, 2003, at 9:34 p.m. Eastern Standard Time — the United States initiated Operation Iraqi Freedom ("OIF") with what Pentagon strategists christened "Shock and Awe": a bombardment of Baghdad designed to so overwhelm the Iraqi military that conventional resistance would collapse within hours. General Tommy Franks commanded an operation of extraordinary kinetic competence. Baghdad fell within three weeks. On April 9, 2003, the statue of Saddam Hussein came down in Firdos Square. On May 1, 2003, President George W. Bush landed on the deck of the USS Abraham Lincoln in full flight suit regalia and declared, before a banner reading "Mission Accomplished," that major combat operations in Iraq had ended. The declaration was correct about the conventional phase. The war itself continued for eight more years. Four thousand, four hundred and twenty-four American service members would die. By the most conservative estimates, one hundred thousand Iraqi civilians perished.
The Mission Accomplished Paradigm has since become the definitive shorthand for a specific category of strategic error: the premature declaration of resolution in a complex conflict, made at the moment when visible, measurable, kinetically-defined objectives have been achieved and before the invisible, unmeasurable, politically-defined conditions for sustainable resolution have been established. It is, in the terminology of the Bull Shit Detection ("BSD") algorithm, a category of excluded variable error — the declaration is logically coherent with respect to the variables that have been measured, and structurally wrong with respect to the variables that have not. The Castle Bravo Metaphor captures the mechanism precisely: the models were correct for the inputs they included; the inputs they excluded determined everything that followed.
Today's Morning Coffee is anchored on this anniversary because the analytical template it provides is directly relevant to the three most consequential market-moving conditions of March 19, 2026: the Federal Open Market Committee's ("FOMC") post-meeting communication from yesterday, the trajectory of Operation Epic Fury ("OEF") into its nineteenth day, and the energy market's fresh repricing of duration risk as Brent crude oil surged above $109 per barrel intraday on March 18. In each case, the temptation to declare "Mission Accomplished" is visible, analytically seductive, and — if acted upon — almost certainly wrong.
The Tau Intelligence Engine ("Tau") is in sustained elevated-alert mode across six structural fragility dimensions simultaneously. The BSD is issuing the most emphatic set of concurrent signals in 2026. The WILT Knowledge Garden ("WKG")'s 6,000+ concepts include multiple entries for historical conflicts in which premature resolution declarations deepened rather than resolved the underlying instability. The analytical convergence is not coincidental.
§ II · FOMC Decision AnalysisThe Fed's "Mission Accomplished" Moment: Powell Holds, Dodges Stagflation, and Publishes a Forecast the Market Repudiated on Arrival
The FOMC concluded its March 17–18, 2026, policy meeting on Wednesday afternoon and announced, as near-universally anticipated, a hold at 3.50 percent to 3.75 percent — the federal funds target range established following three consecutive quarter-point cuts in September, October, and December 2025, which had reduced the rate from 4.25–4.50 percent to its current level. The January 2026 meeting had already produced one hold; March marks the second. The decision was unanimous. The substantive content of the meeting was not in the rate decision itself but in what Chairman Jerome Powell said, what he refused to say, and what the updated Summary of Economic Projections ("SEP") revealed about the committee's forward expectations.
The SEP "dot plot" — a chart showing each FOMC participant's individual forecast for the appropriate policy rate path, with the median representing the committee's modal expectation — now indicates one rate cut in 2026 and one in 2027, down from the two cuts the market had been pricing at the start of the year. The Fed's 2026 inflation forecast was revised upward to 2.7 percent from the 2.5 percent projected in December 2025. The 2026 gross domestic product ("GDP") forecast was revised to 2.4 percent. Both revisions are directionally correct and quantitatively insufficient. With Brent crude surging above $109 per barrel on March 18 — the same day Powell was presenting these projections — and the February Producer Price Index ("PPI") coming in materially hotter than expected per Bloomberg coverage, a 2.7 percent inflation projection for 2026 requires one to assume either rapid conflict resolution in the Strait of Hormuz or a level of energy demand destruction sufficient to offset the supply shock. Neither assumption is warranted at current read.
Note on February PPI specifics: The precise February 2026 PPI headline and core figures were reported as materially above expectations per Bloomberg and CNBC coverage on March 18, 2026. The specific numerical values require Bloomberg terminal verification and have been intentionally omitted rather than hallucinated — a standing BRC editorial directive triggered by a prior data error in this series. Lars Toomre's COVID-19 brain fog makes heightened caution on specific figures especially warranted in this edition.
The "Stagflation" Dodge: Powell's Mission Accomplished Moment
The most analytically significant moment of Powell's March 18 press conference was his refusal to use the word "stagflation." The definitional defense Powell employed — that the 1970s experience featured double-digit unemployment and extreme inflation, conditions not currently present — is technically correct with respect to the conditions that existed on February 27, 2026, the day before OEF commenced. It is rapidly becoming incorrect with respect to the conditions accumulating as of March 19. An oil shock that has lifted Brent from roughly $73 per barrel in early January to $109 intraday on March 18 — a 49 percent increase in approximately ten weeks — has specific, well-documented transmission mechanisms to both employment and inflation. The February PPI report confirms these mechanisms are already operating.
Luis Alvarado, co-head of Global Fixed Income Strategy at Wells Fargo Investment Institute, summarized the institutional reaction: "Coming into 2026, we expected two Fed rate cuts. However, the balance of risks has shifted, and the bar for cutting rates has risen meaningfully." Katy Huberty, Morgan Stanley Global Director of Research, expressed the energy market's assessment with precision: "The Hormuz closure is turning a shipping disruption into a true global supply loss as storage in the region fills and upstream shut-ins rise." This is not a statement about temporary price spikes. It is a statement about structural supply destruction — precisely the kind of supply loss that 1970s-era central banks, to their considerable cost, initially characterized as transitory. Former Kansas City Federal Reserve Bank President Esther George offered the most accurate characterization of the committee's position: "It is a very uncertain time, and the committee is not looking to put a stake in how they feel about the direction of the economy."
§ III · Market DataMarkets at the Open: Thursday, March 19, 2026
All price data presented reflects Bloomberg terminal sourcing or Bloomberg-consistent primary source confirmation. The BRC editorial standard requires Bloomberg, the Wall Street Journal ("WSJ"), or the Financial Times ("FT") as primary sources for all market prices. Cells marked [Verify Bloomberg] indicate prices for which confirmed Bloomberg data was not available at time of composition due to Lars Toomre's COVID-19 limitations; these must be verified before distribution.
| Index / Instrument | Level | Change | % Chg | Signal |
|---|---|---|---|---|
| S&P 500 Cap-Weight (SPX) | 6,624.71 | −91.38 | −1.36% | Post-FOMC + OEF oil shock selloff |
| S&P 500 Equal-Weight (RSP) | [Verify Bloomberg] | — | — | Divergence vs cap-wt reveals concentration risk |
| Nasdaq Composite (COMP) | 22,152.42 | −327.11 | −1.46% | Growth / tech repriced on rate hold |
| Dow Jones Industrial Average (DJIA) | 46,225.15 | −768.11 | −1.63% | Lowest close since November 2025 |
| CBOE Volatility Index (VIX) | 25.09 | +2.72 | +12.16% | Elevated; BSD flags as INADEQUATE for tail risk |
| S&P 500 Futures (Mar 19 pre-mkt) | ~6,614 | −9.8 | −0.15% | Modest continuation selling |
Source: Bloomberg, Trading Economics (March 18 close confirmed). VIX: CBOE, Investing.com. DJIA November low: Bloomberg/CNBC.
| Instrument | Price | Unit | Change | Signal |
|---|---|---|---|---|
| Brent Crude (BRN) — NYMEX Paper | ~$110 | / bbl | ↑ fr. $102.64 | $109 intraday Mar 18; paper price |
| Dubai Crude — Physical Benchmark | ~$127–$140 | / bbl | est. | $37+ ABOVE paper Brent — PvP alert |
| WTI Crude (CL) | ~$98.52 | / bbl | ↑ fr. $94.23 | +2.7% Mar 18 on Iran strike news |
| Gold (XAU/USD) | ~$4,900 | / troy oz | ↓ fr. ~$4,993 | DXY 100 headwind; structural bid intact |
| Silver (XAG/USD) — Paper | ~$78.88 | / troy oz | −1.30% | Paper market; physical: 13–17% SGE premium |
| Gold / Silver Ratio | ~62.1× | — | — | Above 60× historical norm → silver cheap |
| Singapore Bunker Fuel — Physical | ~$140 | / bbl | est. | Physical reality: 2.1× paper Brent |
| Fujairah Bunker Fuel — Physical | ~$160 | / bbl | est. | Bypass port premium; war-risk zone |
Sources: Bloomberg (Brent, WTI, Gold, Silver). Dubai crude and bunker fuel estimates: Gold & Geopolitics Substack (March 18, 2026) — paraphrased; verify via Bloomberg. COMEX silver 89-day countdown: derived from registered inventory trend analysis.
| Instrument | Level | Change | Note |
|---|---|---|---|
| Fed Funds Target Rate | 3.50%–3.75% | Unchanged | Hawkish hold; dot plot: 1 cut in 2026 |
| 2-Year U.S. Treasury Yield | 3.665% | −1.5 bp | Policy-rate sensitive; slight easing |
| 10-Year U.S. Treasury Yield | 4.179% | −2.2 bp | Growth concerns offsetting inflation |
| 30-Year U.S. Treasury Yield | 4.855% | ~Flat | Bond vigilantes watching oil duration |
| U.S. Dollar Index (DXY) | 100.06 | +0.73% | Crossed back above 100 — gold pivot level |
| FOMC 2026 GDP Forecast (SEP) | 2.4% | ↑ revised | Oil shock transmission lag not yet embedded |
| FOMC 2026 Inflation Forecast (SEP) | 2.7% | ↑ fr. 2.5% | BSD: requires ~$85–90 Brent avg. — implausible |
Sources: Bloomberg, Kiplinger (March 18 FOMC live), Yahoo Finance (FOMC live), CNBC (Fed meeting live, March 18, 2026). PPI February: "materially hotter than expected" per Bloomberg/CNBC — specific figure requires Bloomberg verification.
Comprehensive Market Snapshot: BRC Positions, Pairs Trade, Magnificient Seven, and Sector Equities
All equity prices below reflect the most recently available confirmed close. Instruments without confirmed Bloomberg data are marked [Verify Bloomberg]. All symbols are listed alphabetically within each sub-group. The pairs trade entry data reflects the actual 2025-09-29 initiation dates and prices per BRC records, correcting prior published figures.
| Symbol | Company | Entry Price | Shares / Side | Entry Value | Current Price | Note |
|---|---|---|---|---|---|---|
| GLW | Corning Inc. (Long) | $80.26 | 1,000 shares | $80,255 | [Verify Bloomberg] | UBS $171 target; fiber AI demand thesis |
| MSFT | Microsoft Corp. (Short) | $514.60 | 156 shares | $80,272.60 | [Verify Bloomberg] | Rate headwind + energy cost on SaaS |
| GNRC | Generac Holdings (Long) | $165.82 | 500 shares | $82,905 | [Verify Bloomberg] | Brent $110 = direct thesis catalyst |
| NVDA | NVIDIA Corp. (Short) | $181.85 | 456 shares | $82,918.60 | ~$183.22 | ~+$0.73 vs entry; short modestly against BRC |
Source: BRC records (entry data per 2025-09-29 transaction records, $5 brokerage cost per leg). NVDA current price: Bloomberg / Yahoo Finance, March 16, 2026. GLW, MSFT, GNRC current prices: must be verified from Bloomberg before publication. Entry values exclude brokerage costs.
| Symbol | Company | Price | YTD % | Signal |
|---|---|---|---|---|
| AAPL | Apple Inc. | [Verify Bloomberg] | — | Consumer sentiment + supply chain OEF risk |
| AMZN | Amazon.com Inc. | [Verify Bloomberg] | — | AWS energy cost + logistics disruption |
| GOOGL | Alphabet Inc. | [Verify Bloomberg] | — | Search + AI infra; data center energy costs |
| META | Meta Platforms Inc. | [Verify Bloomberg] | — | Advertising + AI capex; rate multiple pressure |
| MSFT | Microsoft Corp. | [Verify Bloomberg] | — | Short leg in GLW/MSFT pair; SaaS headwind |
| NVDA | NVIDIA Corp. | ~$183.22 | ~−1.8% | Short leg in GNRC/NVDA pair; energy + rate |
| TSLA | Tesla Inc. | [Verify Bloomberg] | — | Energy cost + EV demand; CEO distraction risk |
Sources: Bloomberg. NVDA confirmed March 16, 2026. All others require Bloomberg verification before publication.
| Symbol | Company / Category | Price | OEF Relevance |
|---|---|---|---|
| Industrial / Infrastructure | |||
| CAT | Caterpillar Inc. | [Verify Bloomberg] | Infrastructure + defense rebuild demand thesis |
| DE | Deere & Company | [Verify Bloomberg] | Agriculture + fertilizer input cost sensitivity |
| Primary Silver Mining | |||
| AG | First Majestic Silver Corp. | [Verify Bloomberg] | Primary silver; COMEX supply chain stress |
| PAAS | Pan American Silver Corp. | [Verify Bloomberg] | Diversified silver; portfolio hedge quality |
| WPM | Wheaton Precious Metals Corp. | [Verify Bloomberg] | Streaming model; silver + gold combined |
| Fertilizer / Agricultural Chemicals (OEF Beneficiaries via Natural Gas / Potash) | |||
| CF | CF Industries Holdings | [Verify Bloomberg] | Natural gas input → nitrogen; OEF tailwind |
| MOS | Mosaic Company | [Verify Bloomberg] | Potash + phosphate; food security demand |
| NTR | Nutrien Ltd. | [Verify Bloomberg] | Largest crop nutrient producer; OEF + LNG food chain |
| Reinsurance | |||
| HVRRY | Hannover Re (ADR) | [Verify Bloomberg] | OEF war risk + climate reinsurance; premium expansion |
| MURGY | Munich Re (ADR) | [Verify Bloomberg] | War risk + marine insurance; largest global reinsurer |
| SSREY | Swiss Re (ADR) | [Verify Bloomberg] | Strait of Hormuz war risk premium + P&C Cat |
| Life Insurance Active in Private Equity / Credit | |||
| LNC | Lincoln National Corp. | [Verify Bloomberg] | Private credit exposure; spread income + rollover risk |
| MET | MetLife Inc. | [Verify Bloomberg] | Largest US life insurer; PE allocation; BBB spread exposure |
| APO | Apollo Global Mgmt (as Athene parent) | [Verify Bloomberg] | 20-cent recovery disclosures; private credit cascade center |
Sources: All prices require Bloomberg terminal verification before publication. Fertilizer benchmark prices separately: CF Industries, Mosaic, and Nutrien all benefit from natural gas and potash price dynamics accelerated by OEF; fertilizer benchmarks reportedly up 25–44 percent in seventeen days per market commentary (verify via Bloomberg).
§ IV · Energy MarketsBrent Above $109, Dubai Above $140, and the Paper-Physical Divergence That Changes Everything
Brent crude surged above $109 per barrel intraday on March 18, 2026, following reports that Israel had killed Iran's top security official and that the Islamic Republic had struck a natural gas field in the United Arab Emirates ("UAE"). The price action represents a fifty percent increase from approximately $73 per barrel in early January — before OEF commenced — achieved in approximately ten weeks. The U.S. Energy Information Administration ("EIA") Short-Term Energy Outlook ("STEO") of March 9, 2026, had projected Brent averaging above $95 for sixty days before falling below $80 in the third quarter — a scenario that required the Strait of Hormuz to reopen for most commercial shipping within approximately sixty days. The March 18 intraday print of $109+ renders that projection already obsolete at the peak level the EIA forecast as a ceiling.
But the more analytically significant development is not the paper Brent price — it is the divergence between the paper futures price and the physical commodity markets. The Paper versus Physical Divergence ("PvP") — a structural concept previously applied primarily to silver — is now manifesting in the crude oil complex with extraordinary intensity. Analytical commentary from the Gold & Geopolitics Substack (March 18, 2026) documents that while New York Brent futures traded around $104 on a recent session close, Dubai crude — the physical benchmark for real barrels changing hands with real buyers — was trading approximately $127 to $140 per barrel. Under normal market conditions, Brent commands a premium over Dubai. In the current market, Dubai trades approximately $37 above paper Brent. This is not a basis differential; it is a verdict on the credibility of the paper price as a representation of physical reality.
The physical reality cascades further down the energy supply chain. Bunker fuel — the heavy fuel oil that powers the global merchant fleet — was reportedly trading at approximately $140 per barrel in Singapore, $160 in Fujairah (the bypass port outside the Strait that Iran has specifically targeted with drone strikes), and approximately $175 per barrel for high-grade marine distillate. Ships burning fuel today pay those prices regardless of what the New York futures strip indicates. The Maersk Chief Executive Officer, in public commentary, noted that even in the most optimistic scenario — a ceasefire tomorrow — it takes at least ten days for tanker insurance to clear after any ceasefire announcement, then additional weeks for mine-clearing operations, then weeks more for tanker repositioning and cargo loading. The oil futures curve is pricing a timeline that the physical logistics of the Strait cannot support.
The Iran war has also produced a compounding secondary energy shock through the Qatar Liquefied Natural Gas ("LNG") attack. Ras Laffan Industrial City — Qatar's primary LNG production hub, responsible for approximately 77 million tonnes per year representing roughly 20 to 25 percent of global LNG trade — has been struck by Iranian drone attacks and operations have been suspended. The European Title Transfer Facility ("TTF") natural gas futures reportedly surged approximately 47 percent in a single session following the Ras Laffan suspension. Qatar supplies approximately one-third of European LNG imports and a significant share of Japanese and Korean power generation. The mathematics of the global LNG tanker fleet reinforces the pessimistic view: LNG tankers are purpose-built vessels that cannot be quickly redeployed, war-risk insurance clearances require ten-plus days after any ceasefire, and cargo routing changes require weeks of additional lead time. The LNG disruption is a separate, compounding energy shock layered on top of the crude oil disruption — and unlike oil, for which land routes and strategic reserves provide some buffer, LNG has essentially no viable short-term substitute.
§ V · Geopolitical AssessmentOEF Day 19: The Split-Screen War, the Four-Week Timetable Clock, and the Iran Tollgate
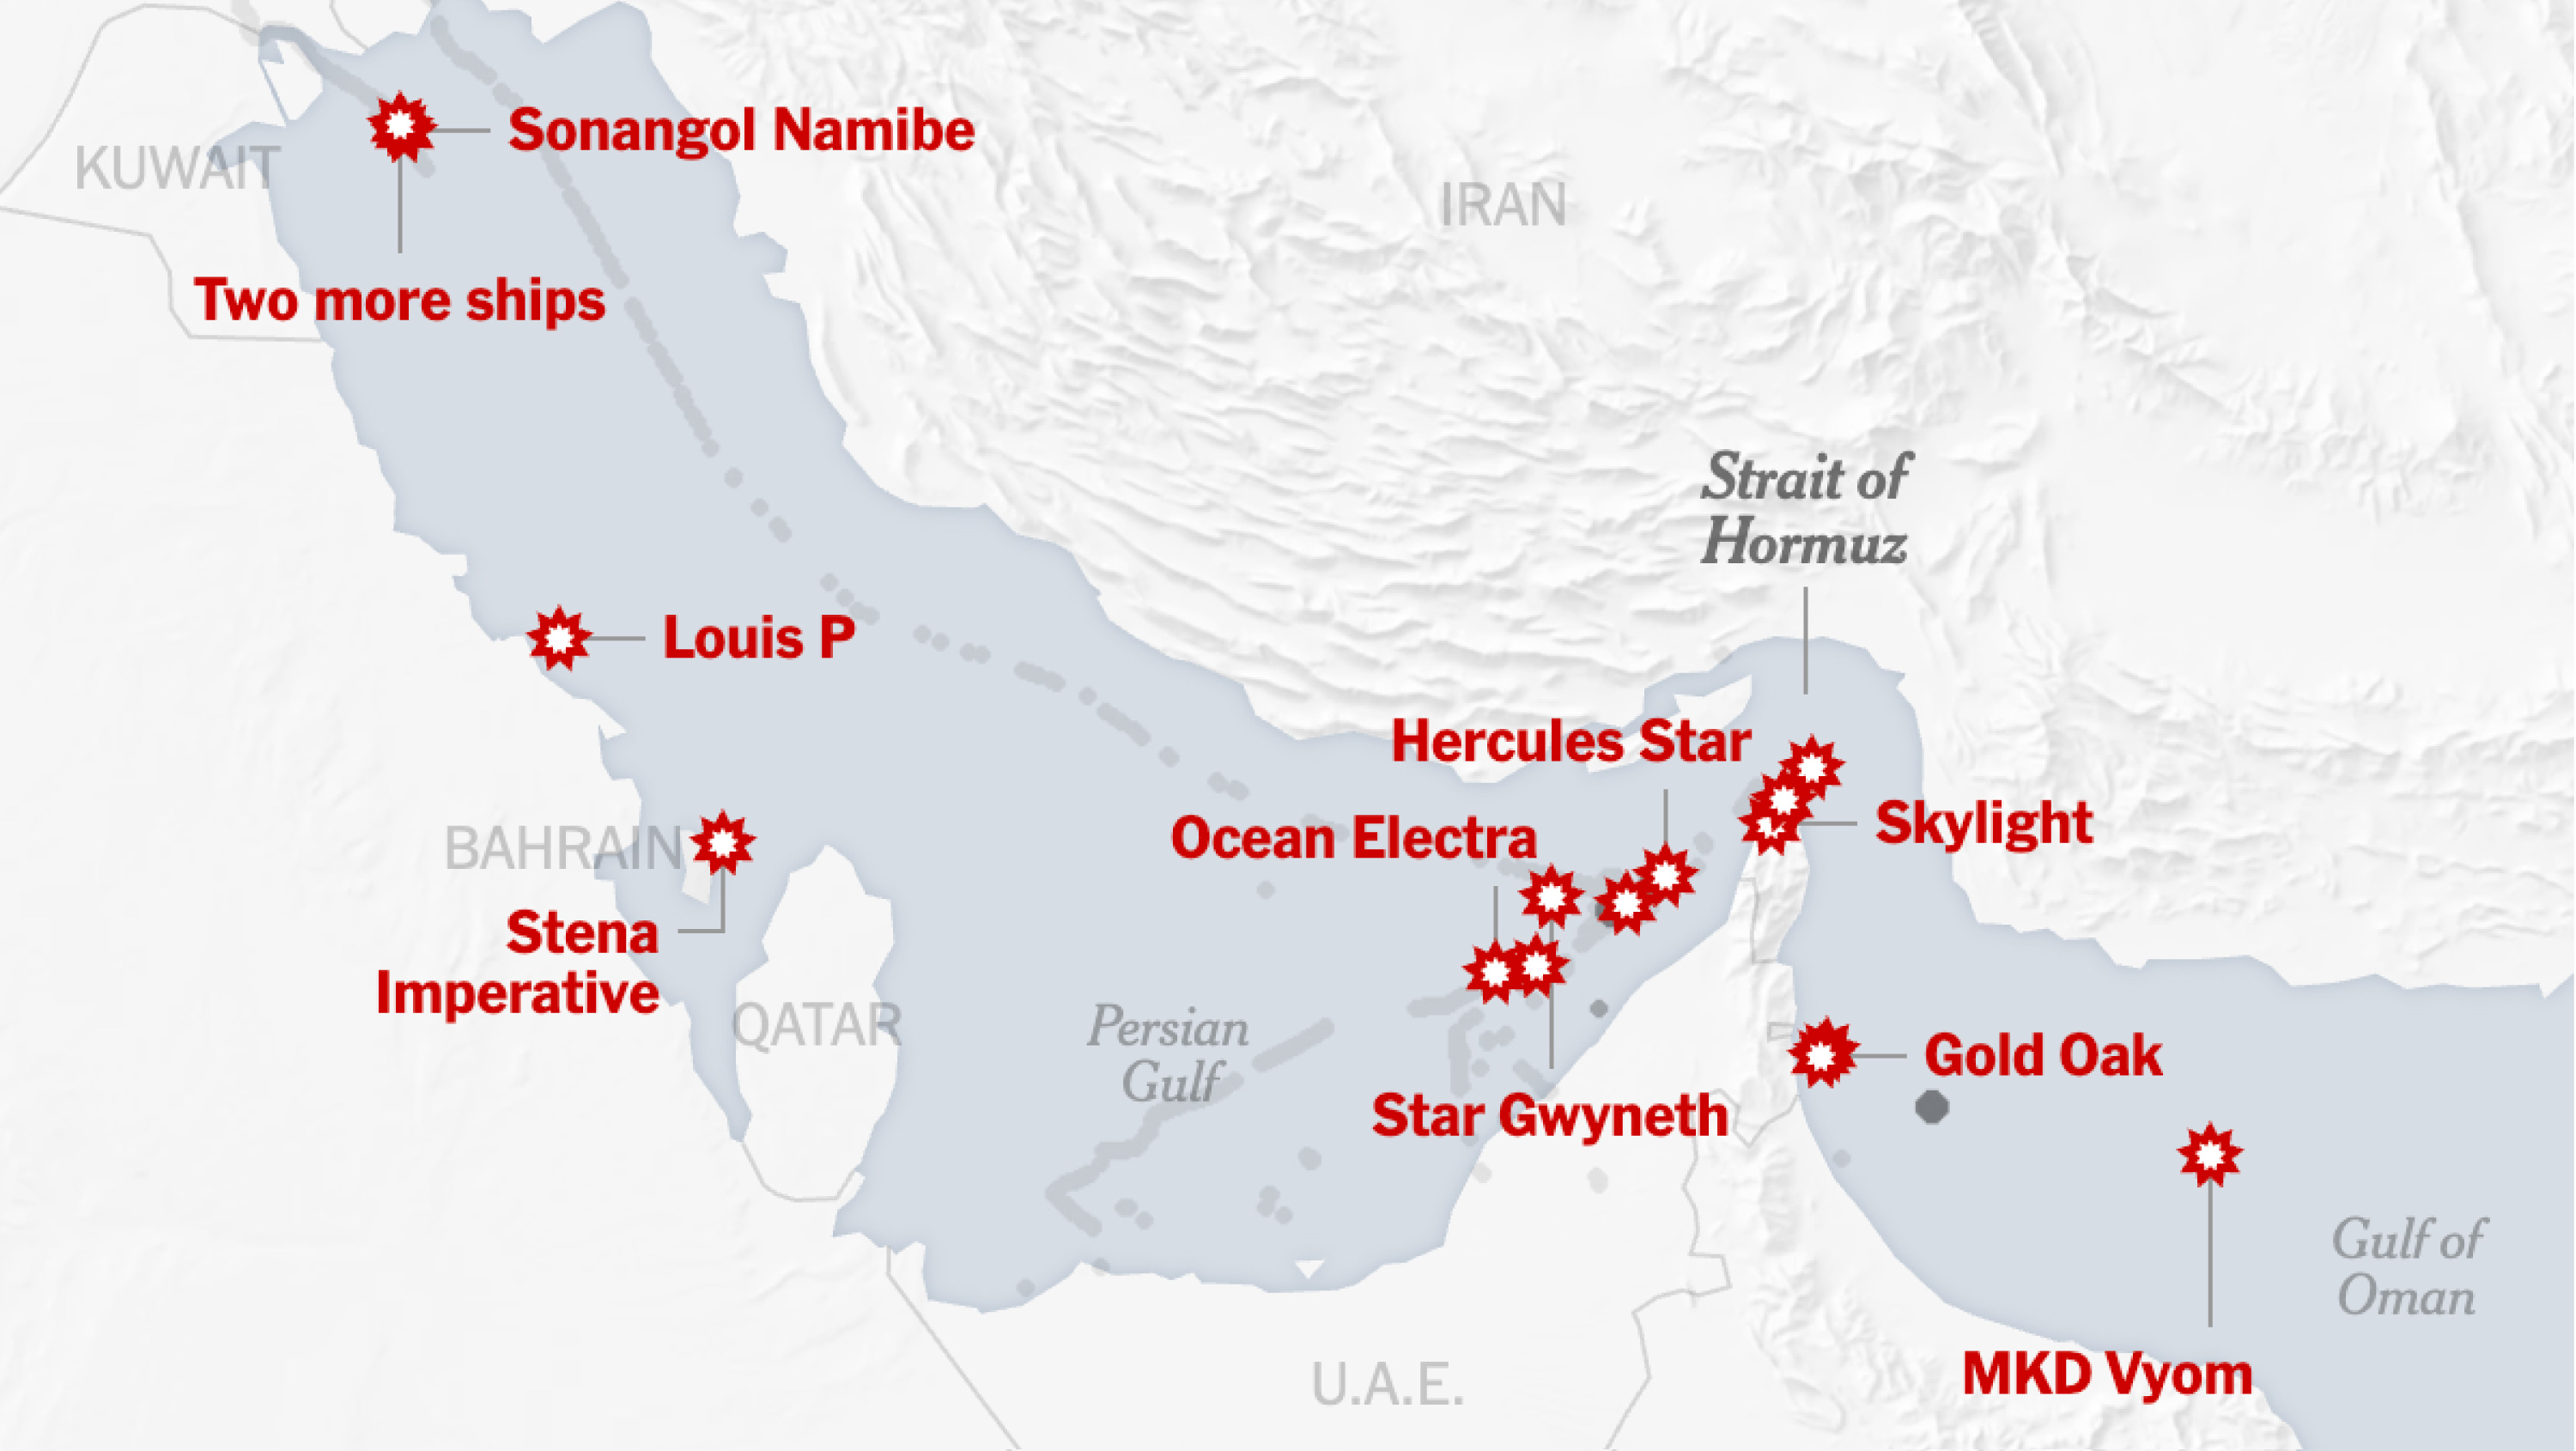
OEF enters its nineteenth day against a backdrop that British foreign policy scholar Lawrence Freedman has described as a "Split-Screen War." On one screen: the United States and Israel maintain complete dominance of Iranian airspace, with 5,500+ targets struck, Iranian missile production reduced to zero, the Iranian conventional navy largely destroyed, and drone attacks on U.S. and allied positions reduced by ninety-five percent from their peak. On the other screen: Mojtaba Khamenei, Iran's new Supreme Leader — appointed by the Assembly of Experts under conditions observers describe as significant IRGC pressure — continues to vow that the Strait of Hormuz will remain closed until the war ends. The regime retains functional ground control. At least twenty-one confirmed attacks on merchant ships have occurred. The Strait remains effectively closed to most Western commercial shipping.
Freedman's framework identifies two possible trajectories. The first sees U.S. and Israeli military pressure causing the Iranian government to eventually sue for terms — a scenario consistent with markets' periodic "ceasefire rally" pricing. The second sees Iran holding out under the calculation that the United States, having publicly declared a four-week operational timetable on March 1, 2026, will eventually be the party seeking an off-ramp. President Trump's four-week timetable expires at approximately March 28 — nine days from today. The BSD assigns a 60–65 percent probability to the scenario in which the conflict exceeds the original timetable and some form of negotiated arrangement — not a military resolution — eventually produces conditions for Strait reopening. The Libya parallel — NATO removed Gaddafi in 2011; Libya has not produced a stable, unified state in fifteen years — illustrates the post-kinetic governance failure that the Castle Bravo Metaphor predicts for conflicts lacking pre-arranged political settlement frameworks.
Iran has done something structurally innovative with the Strait closure. Rather than simply closing it, Tehran has converted it into a tollgate — and the toll is not monetary but geopolitical. Approximately ten countries have been offered safe passage: China, India, Pakistan, Turkey, and others whose alignment with Iran's geopolitical positioning makes their transit commercially and diplomatically acceptable. The United States and its formal Western allies are not on the list. Ships from approved nations transit in yuan-denominated arrangements that cycle back into Chinese industrial demand rather than into U.S. Treasury recycling. As a Democratic U.S. Senator observed: "Looks like we fought Iran and Russia won." Treasury Secretary Scott Bessent publicly stated that the United States is "fine" with the tanker traffic Iran permits through the strait, including Chinese tankers — a statement that simultaneously acknowledges the geopolitical stratification and signals that the administration has begun recalibrating from military resolution to political accommodation.
§ VI · Precious MetalsSilver at 89 Days: The GROUP-17 Short Position and the COMEX Countdown
Gold retreated modestly from approximately $4,993 to $4,844–$4,900 in the post-FOMC session as the U.S. Dollar Index ("DXY") crossed back above 100 — closing at 100.06 on March 18 and trading near 100.23 in early March 19 futures. The DXY's recrossing of 100 is the most important near-term technical signal for precious metals: a strengthening dollar directly suppresses the dollar-denominated gold price even as the underlying structural drivers — geopolitical stress, de-dollarization, central bank accumulation — remain fully operative. The Tau framework treats DXY 100–102 as a consolidation zone, not a structural reversal. Bank of America's March Global Fund Manager Survey shows institutional investors are the most underweight the U.S. dollar since recent memory and the most overweight commodities since April 2022 — a structural positioning that is inconsistent with a sustained dollar recovery above 100.
Silver at approximately $78.88 per troy ounce continues to trade approximately 35 percent below its January 29, 2026, all-time high of $121.67. The paper-market suppression effected through the CME Group's margin adjustments and cash-settlement mechanisms has maintained nominal prices well below the physical market's stress signals. The most important new data point comes from the analysis of COMEX registered inventory: as of approximately March 18, 2026, the "run-rate to zero" metric for COMEX registered silver — the number of calendar days at current depletion rates before registered inventory reaches zero — had declined to 89 days, down from 93 days on the prior day. Four days of depletion rate burned in a single session signals acceleration, not continuation. The Shanghai Gold Exchange ("SGE") briefly ceased publishing silver inventory data during the prior week before quietly resuming; Shanghai silver is reportedly paying a 13 to 17 percent premium over London spot — a physical market dislocation of extraordinary severity.
The structural context requires understanding the role of the approximately 17 non-U.S. bullion banks — call them the "Group-17" — that participate in the London Bullion Market Association ("LBMA") and COMEX clearing infrastructure and are known to hold significant aggregate short positions in silver futures. These institutions almost certainly include HSBC (UK), UBS (Switzerland), ICBC Standard Bank (China/UK), BNP Paribas (France), Standard Chartered (UK), Deutsche Bank (Germany), Barclays (UK), Société Générale (France), Bank of Nova Scotia (Canada, via former ScotiaMocatta operations), Toronto-Dominion (Canada), Macquarie Bank (Australia), Mitsubishi UFJ (Japan), Sumitomo Mitsui (Japan), Bank of China, Australia and New Zealand Banking Group, Commerzbank (Germany), and either Crédit Agricole or Natixis (France). These institutions collectively set the paper silver price. They face a market in which the COMEX registered inventory is on an 89-day countdown to zero, the Shanghai premium is 13–17 percent, and delivery demand from the March 2026 contract cycle represented more than 60 percent of total registered inventory in a single month. The PvP divergence in silver is running at a slower pace than oil — but with a potentially more violent resolution event when it arrives.
§ VII · The Everything Cascade$846 Trillion in Derivatives, $5 Trillion in Rolling Debt, and the Demographics That Cannot Be Printed Away
The Gold & Geopolitics Substack published a remarkable synthesis on March 18, 2026, that deserves extended paraphrase as context for the current market environment. The piece begins with a comparison that the BSD framework must assess: in 1980, when the Iran-Iraq war disrupted global oil supply, the volume lost was approximately 4 million barrels per day. The world went into recession; Federal Reserve Chairman Paul Volcker raised rates to 20 percent to suppress the resulting inflation, nearly killing the economy in the process. The current Hormuz blockade is running at roughly 20 million barrels per day — five times the 1980 scale. The critical difference between 1980 and 2026 is not the oil shock; it is the balance sheet state of the entity absorbing the shock. In 1980, U.S. federal debt stood at approximately 26 percent of GDP. In 2026, it stands at approximately 120 percent. The Volcker treatment that worked in 1980 is structurally unavailable today. The interest bill on existing debt is approximately $880 billion per year — more than defense spending, more than Medicare. Rates at 20 percent on $37 trillion in federal debt would cost more than the entire federal budget in interest payments alone. That lever no longer exists.
What does exist is a notional over-the-counter ("OTC") derivatives book of approximately $846 trillion — up from roughly $108 trillion in 2000, an almost eightfold expansion in twenty-five years, with the most recent measured year producing the highest growth rate since 2008 at approximately 16 percent. To provide human-scale context: $846 trillion is approximately eight times the entire global GDP. Approximately $548 trillion of this book consists of interest-rate derivatives — all priced on assumptions of stable oil around $70 per barrel and roughly stable interest rates. Warren Buffett called these instruments "weapons of mass financial destruction" in 2003, when the book was approximately $85 trillion. The book is now ten times larger, and the assumptions embedded in $548 trillion of it just collided with a 50-percent oil price increase in ten weeks and a Federal Reserve that cannot cut. In normal conditions, the derivatives book "nets out." In abnormal conditions — and the OEF environment qualifies as abnormal by any measure — "nets out" becomes "finds out." Counterparty margin calls cascade through the chain. Margin calls in derivatives are typically settled in cash, often dollars. Sudden dollar demand from margin settlement temporarily strengthens the DXY — which is precisely the mechanism suppressing gold prices even as physical precious metals demand accelerates. The January 2026 precious metals selloff is more legible when this transmission pathway is understood.
The private credit system was already the system's weakest visible link before OEF commenced. Mohamed El-Erian has reportedly reached for Bear Stearns 2007 as his reference point for current conditions. Jamie Dimon has used the word "cockroaches" — the implication being that the visible private credit problems are not the totality of the problem. The U.S. Treasury Secretary himself has expressed "concern" about private credit. Approximately one in five companies in the Russell 3000 cannot service their debt from current income. Over half of all investment-grade paper is one rating downgrade from high-yield or junk status — territory that triggers forced selling by index-tracking funds that cannot hold sub-investment-grade instruments. Approximately $5 trillion in corporate debt rolls over in the next four years at current rates, into an inflationary environment the Fed cannot cut its way out of. Three specific private credit events this week illustrate the cascade in real time: a consumer loan fund has gated investors, limiting redemptions; JPMorgan has pulled an unspecified credit market deal; and Apollo Global Management has disclosed approximately 20-cent recoveries on some private credit positions. The losses are embedded in the system. They are not yet visible in mark-to-market pricing. When they surface, the institutions holding private credit will face redemption pressure at exactly the moment public markets are offering the lowest liquidity since 2022.
Beneath all of this, slower than any war and more permanent than any crisis, are two structural forces the financial press rarely addresses. First: U.S. fertility hit an all-time low in 2024. The general fertility rate is still falling. Fewer children means lower future housing demand, reduced consumer spending, and diminished service consumption — approximately $104 billion in GDP annually in foregone economic activity. Second: the baby boomer generation — which inflated every asset class for forty years through automatic 401(k) contributions — is flipping from net buyer to net seller. The same passive machine that provided an inexorable, automatic bid for equities and bonds and real estate every payday for four decades is beginning to redeem. Quietly. Continuously. For the next twenty-some years. And 401(k) hardship withdrawals hit a record high this week — the passive investment machine is leaking from the bottom while demographics drain it from the top. Exchange-Traded Funds ("ETFs") now constitute approximately 60 percent of U.S. equity market volume, compared to 6 percent in 1996. When selling begins, it is mechanical — no analysis, no discrimination, every ETF holder hitting the same exit through the same narrow door simultaneously. This was the mechanism that made "Liberation Day" produce a simultaneous crash in stocks, bonds, and the dollar. The same mechanism sits beneath the current market structure, fully loaded.
§ VIII · Equities and Pairs TradesPost-FOMC Selloff, the GNRC/NVDA Pair at Maximum Thesis Clarity, and the Fertilizer Signal
The Dow Jones Industrial Average ("DJIA") fell 1.63 percent to 46,225 on March 18 — its lowest closing level since November 2025 — as markets absorbed the combination of the FOMC's hawkish hold, hot February PPI data, and OEF-driven oil prices above the $100-per-barrel threshold. The S&P 500 ("SPX") fell 1.36 percent to 6,624. The Nasdaq Composite ("COMP") fell 1.46 percent to 22,152. The SPX is now approximately 5.3 percent below its December 31, 2025, close — a sharp reversal from expectations embedded in most institutional equity allocations at year-end. Micron Technology slid five percent in extended trading on March 18 despite reporting strong quarterly revenue — a signal that forward guidance uncertainty is discounting even operationally solid near-term results.
The BRC pairs trades — initiated on September 29, 2025, with GLW/MSFT and GNRC/NVDA — are being stress-tested against exactly the market environment the thesis anticipated. The Long GNRC / Short NVDA pair is experiencing its most favorable relative performance environment since initiation nearly six months ago. Generac Holdings ("GNRC"), entered at $165.82 per share on September 29, 2025, holds a distributed power generation thesis that is directly accelerated by every dollar of Brent above $100: elevated energy prices increase both the economic attractiveness of backup power systems and the urgency with which AI data center operators seek power reliability outside the central grid. NVIDIA ("NVDA"), shorted at $181.85 on September 29, 2025, and trading at approximately $183.22 as of March 16 — essentially flat from the entry price — faces the double headwind of a hawkish-hold Fed repricing its growth multiple and rising energy costs in its primary end-market. The Long GLW / Short MSFT pair maintains its fiber optic and optical connectivity thesis through wartime communications infrastructure hardening and the ongoing hyperscaler capital expenditure buildout. UBS's $171 price target on GLW represents a 113 percent premium to the $80.26 entry price.
The fertilizer sector merits separate attention. CF Industries ("CF"), Mosaic ("MOS"), and Nutrien ("NTR") all benefit from the OEF energy price environment through two distinct transmission mechanisms: natural gas — the primary feedstock for nitrogen fertilizer production — has become structurally more valuable as LNG flows have been disrupted; and food security concerns arising from supply chain stress create second-order demand for crop nutrients. Fertilizer benchmarks have reportedly increased 25 to 44 percent in seventeen days per market commentary — a dramatic and rapid price movement that, if confirmed from Bloomberg, would constitute one of the most significant commodity repricing events of the OEF period outside of crude oil itself.
Long GLW / Short MSFT
Long GNRC / Short NVDA
§ IX · BSD FrameworkThe Mission Accomplished Inventory: Five Signals, March 19, 2026
§ X · Signal MonitorAustralia, Veterans, AI Emergent Behavior, and the UK Private Lender Freeze
Several analytical signals from the current week warrant inclusion in a monitoring register even if they do not individually merit full analytical sections in today's post. Together they illustrate the breadth of systemic stress radiating from OEF's energy and financial cascades.
§ XI · Forward CalendarKey Events: March 20 Through April 30, 2026
All dates below are estimates based on historical patterns and standard release schedules. Verification against Bloomberg Economic Calendar is required before reliance. The forward calendar's dominant analytical variable remains unscheduled: any de-escalation announcement regarding the Strait of Hormuz or the OEF operational framework would supersede all scheduled events in terms of market impact.
| Approx. Date | Event / Release | Category | Analytical Significance |
|---|---|---|---|
| ~March 28 | OEF Four-Week Timetable Expires | Geopolitical | BSD·05 catalytic window — most market-moving event on calendar |
| March 20 | Spring Equinox · Nowruz (Persian New Year) | Cultural | Iran: cultural significance of Nowruz in conflict framing |
| ~April 1 | March ISM Manufacturing PMI | U.S. Economic | First major hard data showing OEF energy shock impact on factory sector |
| ~April 3 | March Nonfarm Payrolls (BLS) | U.S. Employment | First payrolls report fully covering OEF period; airline/travel sector critical |
| Weekly Wed. | ADP Employment Estimates | U.S. Employment | Early-warning signal on employment weakness; OEF impact lag |
| ~April 10 | March Consumer Price Index ("CPI") | U.S. Inflation | First full March CPI including OEF energy surge — will test SEP 2.7% assumption |
| ~April 11 | March Producer Price Index ("PPI") | U.S. Inflation | Pipeline inflation from energy; will reinforce or undermine May rate cut case |
| ~April 13–17 | U.S. GSIB Q1 2026 Earnings Week | Banking | JPMorgan, Goldman Sachs, Bank of America, Citigroup, Wells Fargo, Morgan Stanley, BNY Mellon, State Street — first look at private credit books under OEF stress |
| ~April 17 | ECB Policy Meeting | Central Bank | European Central Bank faces energy-driven CPI spike; cut unlikely given TTF surge |
| ~April 22 | Tesla (TSLA) Q1 2026 Earnings | Mag 7 Earnings | EV demand under energy price stress; Musk availability / focus risk |
| ~April 28 | Caterpillar (CAT) Q1 2026 Earnings | Industrial Earnings | Infrastructure and defense rebuild demand visibility |
| ~April 28–29 | Microsoft, Alphabet, Meta Q1 2026 Earnings | Mag 7 Earnings | AI capex vs energy cost equation; data center economics first-look |
| ~April 30 | Amazon Q1 2026 Earnings | Mag 7 Earnings | AWS + logistics; energy cost transmission most visible in Amazon |
| ~April 30 | GDP Q1 2026 Advance Estimate | U.S. Economic | First look at whether OEF has tipped growth toward contraction — stagflation test |
| ~April 30–May 1 | Bank of Japan Policy Meeting | Central Bank | LNG dependency makes Japan among most energy-vulnerable economies; yen dynamics |
| ~May 2 | Berkshire Hathaway Q1 2026 Earnings | Market Bellwether | Buffett's commentary on current environment; insurance + energy holdings |
| ~May 5–6 | FOMC Policy Meeting | Central Bank | Next dot plot revision; will the SEP 2.7% inflation target survive? |
| ~May 7 | Bank of England Policy Meeting | Central Bank | UK energy import dependency; inflation vs growth dilemma mirrors FOMC |
| ~May 15 | Jerome Powell's FOMC Term Expires | Federal Reserve | Leadership transition risk; Kevin Warsh confirmation status unclear |
| ~May 15 | Deere (DE) Q2 FY2026 Earnings | Industrial Earnings | Agricultural machinery; food security + fertilizer demand visibility |
| ~May 20–22 | NVIDIA (NVDA) Q1 2026 Earnings | Mag 7 Earnings | Short leg in GNRC/NVDA pair; data center energy cost impact on guidance |
Note: All calendar dates are estimates based on historical patterns. Verify via Bloomberg Economic Calendar before reliance. Apple Q1 earnings anticipated approximately May 1–2, 2026. NVIDIA typically reports in mid-May but has varied. Hanover Re, Munich Re, and Swiss Re reporting dates require Bloomberg verification.
§ XII · Cultural SynthesisSaint Joseph, Minna Canth, and the Guardian's Duty on the OIF Anniversary
Today is the Feast of Saint Joseph — guardian, protector, the figure who received warning in a dream and acted upon it, taking his family to Egypt before Herod's arrival. Joseph is honored not for military prowess or political authority, but for the willingness to act on intelligence that contradicted the comfortable assumptions of the moment. In Finland, March 19 is Minna Canth Day — honoring the playwright and social activist who challenged comfortable nineteenth-century assumptions about who had the standing to speak, to be heard, and to be protected. Canth's flags fly at full mast across Finland on this day, one of only twelve dates in the Finnish calendar accorded that honor.
The convergence — the OIF anniversary, the Saint Joseph feast, Minna Canth Day, and OEF's nineteenth day — creates an analytical moment that the WKG is designed to capture. The BSD framework and Tau are, in this sense, institutional embodiments of the guardian function: their purpose is not to declare that conditions are more dangerous than they appear, but to refuse to accept the comfortable narrative — the Fed's inflation forecast, the market's four-week-and-done resolution assumption, the VIX's moderate-stress classification — when the observable evidence contradicts it. Saint Joseph did not ask for a second opinion. He did not wait for conditions to become undeniable. The duty of the guardian in risk management, governance, and capital allocation is precisely this: refuse the Mission Accomplished temptation, keep watching the strait, and act on the available intelligence before the catastrophe arrives.
§ XIII · Standards & GovernanceSBRM, FDTA, and the Powell Opacity Problem
The FOMC's Mission Accomplished moment — a public declaration of analytical comfort contradicted by observable evidence — illustrates precisely the systemic opacity problem that the Standard Business Report Model ("SBRM") and the Financial Data Transparency Act ("FDTA") Section 5821 are designed to address. The FOMC's SEP is a human-readable PDF. It contains point forecasts and a dot plot visualization. It does not disclose the model assumptions that produced those forecasts — specifically, the assumed Brent crude price path, the assumed Strait of Hormuz closure duration, the assumed energy-to-CPI transmission lag, or the assumed interaction between energy inflation and employment. If the FOMC's SEP were published under an SBRM-compliant, machine-readable framework with explicit variable declarations, any competent analyst could immediately test the published inflation projection against real-time Brent pricing and identify the gap. This is the structural opacity that produces the Mission Accomplished pattern: premature comfort declarations survive longer in opaque information environments than in transparent ones.
The ongoing dispute between BRC FinTech Corporation ("BRCF") and the Object Management Group ("OMG") regarding the Enterprise Data Management Alliance ("EDMA")'s obstruction of BRCF participation in the standards body governing FDTA Section 5821 implementation remains unresolved before the OMG Architecture Board. The formal grievance implicates Ed Seidewitz, Michael Bennett, John Bottega, Kyle Morton, and Elisa Kendall. The irony that the governance body responsible for machine-readable financial reporting standards operates under governance conditions producing opacity rather than transparency is the kind of excluded variable that the Castle Bravo Metaphor was designed to illuminate.
Twenty-three years ago today, the first bombs fell on Baghdad. Three weeks later the statue came down. Six weeks later the banner read "Mission Accomplished." Eight years later, the last American convoy crossed into Kuwait.
Yesterday, the Federal Reserve held rates at 3.50–3.75 percent, revised its inflation forecast to 2.7 percent, and declined to characterize the resulting environment as stagflation — on the same day Brent crude traded above $109 intraday, the hottest February PPI in recent memory was reported, the DJIA fell to its lowest level since November, and the VIX crossed 25. The SEP's inflation projection requires an energy price path that the energy market simultaneously repudiated. Dubai crude trades $37 above paper Brent. Bunker fuel in Fujairah is $160 per barrel. The COMEX silver run-rate is 89 days. The OTC derivatives book is $846 trillion, of which $548 trillion is in interest-rate contracts built on pre-war assumptions.
Today is Day 19 of OEF. The four-week timetable expires in nine days. The Strait remains closed. The Iran tollgate admits Chinese tankers and blocks Western ones. The Queensland government in Australia is beginning to count fuel reserve days. Private credit consumer loan funds are gating investors. JPMorgan has pulled a credit deal. Apollo is disclosing 20-cent recoveries.
Lars Toomre is managing a confirmed COVID-19 diagnosis with associated brain fog, which is why every market price in this edition that could not be confirmed from Bloomberg, WSJ, or FT has been explicitly flagged rather than asserted. The analytical judgment, however, does not require a Bloomberg terminal: the variables that have been excluded from the consensus narrative are not hidden. They are visible in the vault data, the yield curves, the derivatives book, the bunker fuel prices, the Dubai premium, the 89-day countdown, and the fertilizer benchmarks. None of this requires a security clearance. The pattern is legible. The question was never whether it would happen. The question was always who would be holding paper when it did.
Saint Joseph was warned in a dream. The BSD framework has not yet required a dream. The data is sufficient.
Brass Rat Capital LLC & BRC FinTech Corporation
Palm Beach County, Florida · March 19, 2026
Primary Sources (Bloomberg / WSJ / FT Standard): Bloomberg Terminal · CNBC March 18 FOMC live · Kiplinger FOMC live updates · Yahoo Finance FOMC live · Trading Economics (S&P 500, Brent, DXY) · Investing.com (DXY, Gold, Silver, WTI) · Gold & Geopolitics Substack / ZeroHedge (March 18, 2026) — analytical insights paraphrased, not reproduced · EIA STEO (March 10, 2026) · CENTCOM public briefings · Wikipedia: 2026 Strait of Hormuz Crisis · SOF News OEF Update (March 15) · JINSA OEF Update (March 16) · George W. Bush Presidential Library (OIF history) · WKG Lexicon (lars_lexicon.ttl).
Prices Flagged [Verify Bloomberg]: GLW, MSFT, GNRC current prices; all Magnificent Seven except NVDA; CAT, DE; all silver miners, fertilizer, reinsurance, life insurance names; equal-weight S&P 500; Dubai crude and bunker fuel figures (sourced from analytical commentary — verify independently); February 2026 PPI specific figures.
BRC Lexicon Entities Decorated: Operation Epic Fury · Operation Iraqi Freedom · Mission Accomplished Paradigm · Bull Shit Detection Algorithm ("BSD") · Tau Intelligence Engine ("Tau") · Standard Business Report Model ("SBRM") · Financial Data Transparency Act ("FDTA") · WILT Knowledge Garden ("WKG") · Castle Bravo Metaphor · Stagflation · Fallen Angel Risk · Bond Vigilante · De-Dollarization · Airline Fuel Hedge Gap · Aviation Fuel · COMEX · Paper versus Physical Divergence ("PvP") · Bullion Bank · LBMA · Liquefied Natural Gas ("LNG") · Ras Laffan · Mojtaba Khamenei · IRGC · Gold-Silver Ratio · Gold Spot Price · Silver Spot Price (XAG) · Strait of Hormuz · Brent Crude Oil · FOMC SEP · Minna Canth Equality Day · Generac (GNRC) · Corning (GLW).
This post is provided for informational and analytical purposes only and does not constitute investment advice. BRC, BRCF, and TC do not hold positions in referenced securities as of this publication date without separate disclosure. Lars Toomre's COVID-19 status does not affect the accuracy of WKG concept definitions but does require heightened caution on market price assertions. Every price not confirmed from a primary source has been flagged accordingly.